Saturday, September 20, 2014

Why there's no market turmoil on Vulcan

(Published in the South China Morning Post on 26 August 2007)

It is hard to think of something to say about the recent upheaval in world financial markets that hasn't already been said either this time round or following previous crashes.

History is prone to repeat itself, especially in the world of finance. This is because markets are the ultimate expression of human nature on a mass scale, and human nature, with its predilections for occasional irrational behaviour, remains con-
Stant.

Take humans out of markets and they would be a dull affair. Were CNBC broadcasted on the planet Vulcan, for example, correspondent Spock of Logical Securities would report: "Once again, all stocks rose today by 0.03 per cent. This is the expected rate of return and is fixed for all stocks as our perfect foresight means there is no risk. "Like yesterday, and the day before that, today's earnings results were all in line with expectations, not surprising really, given that we know exactly what the future will bring and that we all behave totally rationally."

It is our innate irrationality that drives markets. Much has been written about the role of computer algorithm traders, known as quants, in the recent selloff. Surely if computers, devoid of emotion, play more of a role in dishing out buy and sell instructions, markets should become more rational, right?

Wrong. Computer models are, of course, written by humans, and if they're all the same, which they are, herding becomes even more in-
tense.

In fact, in many ways the sharp decline in volatility and the attendant steady rise in markets in recent years were synonymous with the hypothetical Vulcan stock market. The problem was that everyone woke up one day and remembered that we lived on a planet called Earth where it was humans who approve home mortgages to borrowers with no income, humans who securitised and rated them and humans who bought them. Oh yes, and it was humans who programmed computers.

Goldman Sachs chief executive David Viniar, in a call to investors in its funds that had been damaged by their use of computer modelling; said: "We are seeing 25 standard deviation events, several days in a row." To put this into English, he was suggesting that what had happened in markets was something that should only be expected to happen every several trillion years.

Since this in itself is absurd, because it did happen; what Mr Viniar was admitting was that the models were flawed.

In this case, the computer models are not human enough. They do not take account of the impact on financial markets of their buy and sell orders, also known as the feedback effect. Self-awareness is a uniquely human trait and one that is impossible to build into computer programs given our current programming skills and computer capabilities.

There is talk of artificial intelligence and non-linear neural networks that will address this issue, but for now it remains just talk. And anyway, most of the time computer models work just fine. It's just that their very existence will mean that we'll occasionally have these increasingly-hard-to-understand ruptures in the financial markets.

It wasn't that long ago that it was the bank managers who extended loans and they knew where to find you. But times have changed and nowadays things are more complex. While this complexity on the whole improves efficiency in the financial industry, it also means that the occasional bout of panic gets amplified.

On the radio last week, a reporter asked what has become a common question — whether the rating agencies should shoulder some blame for not warning us of the imminent collapse of stock markets.

This is another absurd proposition, as it suggests that we have the capability to panic in an orderly fashion. What were the rating agencies to do? Say that everything will be fine and dandy as long as we don't rush for the exit en masse?

The fact is that the warnings were there for anyone who wanted to listen. But by then it was too late — our lemming-like mentality had taken over.

The behaviour of the ratings agencies is merely symptomatic of the problem, the root of which lies in the increased complexity of financial instruments, which in turn lies in the increased demand for risk management tools, which itself lies in our negative emotional response to financial loss, which ultimately lies in human nature.

Get the gist?

This imperfection in our psychology has been exacerbated by our desire to describe the world in a mechanistic, Newtonian way, rather than qualitatively. Thanks to Harry Markowitz et al, we have been wrongly persuaded that volatility is bad since it is synonymous with risk. His idea that investors get rewarded for assuming more risk was a sound one but his model required a quantitative measure of risk, for which he chose the standard deviation — the volatility — of historic returns.

The fact is, the uncertainty associated with market crashes cannot be defined by the bell curve as his the sudden, unpredictable lurches in volatility like we had in the past month that presents true risk not the normal sweeping ups and downs.


Rule 1: Know your investment target

(Published in the South China Morning Post on 24 June 2007)

Watching recent footage on television of punters gathered around computer screens at Shanghai brokerage outlets, poring over charts of stocks in their portfolios, made me wonder whether they have any idea what they actually own?

I recall visiting one of these outlets in the early nineties and witnessing an impromptu lecture on Elliot wave theory on market cycles — so I was told — given by a gentleman who would have made a rickshaw driver look well dressed.

Not much, it seems, has changed.

As with all stock-market bubbles, irrationality reigns supreme, and investors lose sight of what they are actually acquiring.

Did a buyer on Friday of 9,400 Kweichow Moutai A shares at 121 yuan, for example, consider that he bought one hundred thousandth of the assets and liabilities of the company?

Does he know that if he drank the annual production capacity he effectively owns, he would need to guzzle 100kg, or 2,000 bottles, of Moutai — not to mention the company's other products?

And, perhaps most importantly, does he know he paid 173 yuan for one yuan of dividends, representing a paltry yield of 0.5 per cent?

I doubt it. If he is like so many other investors, yield is how much his shares are going to rise in the next month. As far as he is concerned, what he owns is that colourful line on the computer screen, and the rewards he expects are in the same ballpark as those won at a casino, the stock exchange's not-so-distant cousin.

You might think this column is about stock-market bubbles. It is not. The above example simply illustrates how easy it is to disregard what one actually owns when dabbling in shares, a luxury you may think you can afford while a bubble lasts.

But bubbles always go pop.

As billionaire investor Warren Buffett famously remarked, "Only when the tide goes out do you discover who's been swimming naked".

The point is that it is always a good idea to know what you're buying, even — or particularly— if others don't. Most companies are sufficiently capable of presenting their best side (take the case of Enron). It is therefore more a question of you working out who is wearing Speedos.

The best way to quickly work out what lies beneath the surface is to read a company's latest annual report, which should be available on its website. (If it isn't, that is a good reason to avoid the stock anyway— either they don't want you to see it or they're dumb, both negatives.)

You do not need a CFA or a holiday weekend to work it out either. Here is a 12-point guide to tearing apart an annual report in 10 minutes.

No doubt many will find this all a bit basic, but then rarely is sticking to the basics in any activity a bad idea.

Note that companies that do not pass the following test are not necessarily bad investments. There will be plenty of interesting situations that slip through the net.

What this checklist tries to do is identify companies that will make very steady, long-term investments, for sensible investors who have a reasonable amount of time to dedicate to the pursuit of stock picking.

As in astronomy, it is all about having an efficient way to decide where to point your telescope so that you give yourself the best chance of finding stars.

·               By looking at the annual report for one or two minutes are you able to understand what the company does? There are, no doubt, companies that are very difficult to understand but whose shares perform well. However, you may not be able to sleep comfortably at night not knowing how their success is being achieved.

·               Do you think that demand for the company's products will rise in a relatively steady fashion over the long term? This will discount cyclical stars such as commodity and semiconductor companies that may take you on a wild ride.

·               Does the company have a reasonably dominant position in its industry? On the whole, dominance is a good thing as all sorts of good things come with it, such as economies of scale and high barriers to entry.

·               Do you think that brand value matters to the company? Brand value can add several percentage points to a company's profit margin and is a significant competitive advantage. It is therefore something that companies treasure and, in the absence of incompetence, can last forever.

·               If the company has a mission statement or a set of core values at or near the front of the annual report, do you feel that a lot of thought and care went into their composition? Companies who stick inane, generic statements at the front of their annual reports are not making much effort to sell themselves to you, and likely in other ways as well.

·               Does the annual report contain a table summarising the company's five or 10-year financial track record, and does it show a relatively stable history? This point is partly related to the fact that companies that include clear, long-term historic data have made a conscious effort to provide useful information, and partly to check that the company has not had a volatile past.

·               In the notes to the accounts, does the list of subsidiaries cover more than two pages? The choice of two pages is fairly arbitrary, particularly since font size can vary and disclosure requirements can vary from country to country. The point is that, as with question one, it is more difficult to feel comfortable investing in complex corporate structures. At best they are difficult to understand. At worst, complex structures can be indicative of something more sinister.

·               Are there any worrying qualifications in the auditor's report? As a rule of thumb, any qualification is worrying.

·               Compared with other annual reports, do you get the impression that the company looks after its employees? Companies are nothing without their employees. A sign that a firm appreciates this fact is always heartening.

·               Does the company have a worth- while profit margin? Profit margins vary from industry to industry, so there is no specific target rate. I therefore tend to use return on equity as a better measure of profitability and look for companies whose returns have been above 15 per cent annually for the past five years.

·               Does the company have a strong balance sheet? As a general rule, stick to firms with net debt to equity ratios below 30 per cent. The legendary stock investor Philip Fisher said he never invested in highly geared companies, even if they were well run.
  
·               If the company's investment programme has required external finance, has this been sourced mostly with equity? Intensive fixed asset investment programmes can present exciting opportunities, particularly since they tend to depress profits in the short term, resulting in share price weakness. But financing them with debt is generally a bad idea. In the cash flow statement, add together investments in subsidiaries, fixed assets and other non-current assets, and subtract "cash flow from operations". A red flag should go up if this number is less than double the amount under "increase in debt" (one or more items in the "cash flow from financing activities" section of cash flow statement). Again, this yardstick is somewhat arbitrary and there will almost certainly be specific issues that complicate the picture, but carrying out this calculation should be instructive.

Even though an annual report is a backward-looking document, it is probably the most efficient way to identify companies that are well placed to do well in the future. To quote the "Oracle of Omaha" again, "If a business does well, the stock eventually follows".


Paying the price of overconfidence

(Published in the South China Morning Post on 7 January 2007)

Poor decision-making is largely to blame for the dreadful returns realised by US mutual fund investors. That is the conclusion of the Dalbar study, a yearly analysis of fund flows and fund performance first published in 1994.

From 1984 to 2002, US equity mutual fund investors earned an average annual return of 2.6 per cent compared with 12.2 per cent for the S&P 500 Index.

Dalbar estimated that 2.9 percentage points of the difference were due to fund underperformance and operating costs while a staggering 6.7 percentage points were due to poor decision-making by investors, specifically poor timing and fund selection.

In fact, John Bogle, who founded Vanguard Group and the first index fund, testified to the US Congress in 2003 that the returns were even worse on a dollar-weighted basis. Accounting for the huge sums that investors poured into "hot" technology funds in 1999 and 2000 at the top of the market, Mr Bogle estimated that returns were significantly in the red over the period.

Behavioural finance experts explain this poor decision-making in terms of our natural tendency towards overconfidence and bias. Researchers say people consistently overrate their knowledge and skill.

In their paper in the Sloan Management Review in 1992, Edward Russo and Paul Schoemaker presented the results of their tests in which securities analysts and fund managers were posed a series of questions and, in addition to being asked for a precise answer, were also asked for a range in which they were 90 per cent sure the actual answer resided. On average, the analysts chose ranges wide enough to accommodate the correct answer only 64 per cent of the time. Fund managers were even less successful at 50 per cent. Groups that very accurately calibrated their confidence levels included weather forecasters, bookmakers and professional bridge players.

So how does this overconfidence among fund investors manifest itself when it comes to. decisions to buy and sell mutual funds? Overconfidence impedes performance because investors consider outcome ranges that are too narrow. For example, if markets have fallen, investors significantly underestimate the likelihood of them bouncing. And the belief that a "hot" fund will continue to be so often becomes dogmatic.

Paradoxically, overconfidence prevents you from being aware of your overconfidence. I hear myself saying, "No! You are wrong! I am certainly not overconfident," in response to being so accused. We need to be shown the evidence.

Here goes. In a room of 30 people, what is the probability that two people share the same birthday? One in 100? One in 200? It can't be more than 10 per cent, can it? Well, it's actually 71 per cent. Surprised?

An example of erroneous perception is provided by "the Monty Hall problem", named for the host of US TV's Let's Make A Deal: you are on a game show where the objective is to win a car. The host shows you three doors and says there is a car behind one of them and a goat behind each of the other two. He asks you to pick a door. You pick a door but it is not opened. Then the host, who knows what is behind each door, opens one of the two you didn't pick to reveal a goat. He then offers you the chance to change your pick to the other unopened door. What should you do?

The problem was sent to Parade magazine's Ask Marilyn column in 1990. Author Marilyn vos Savant answered that you should always switch doors as this doubled your chances of winning from one in three to two in three. There was an avalanche of letters to the magazine, some from writers with a PhD in mathematics, saying she was wrong, and accusing her of lowering education standards. (Incidentally, Mrs vos Savant held the Guinness world record for the world's highest IQ from 1986 until 1989, when the ranking was abolished.)

You may think, as I did at first, that Mrs vos Savant is wrong and that switching doors wouldn't alter the odds. Surely, if there are two doors left, the chances are 50-50 either way, right? Wrong. I spent an entire evening trying to persuade one of my smarter friends that by switching doors you increase your odds. Not only did he disagree, but he was convinced he was right. I resorted to tearing up three pieces of paper, marking one with a cross, and repeatedly playing the game until he saw empirically the switching strategy did in fact double the chances of winning.

Once you are able to recognize the overconfidence that causes errors in your perception, you will be in a better position to make more sensible investment decisions.

The problem is that overconfidence otherwise helps us in our daily battle for survival. But while the need to appear competent and confident might help, for example, in securing a job promotion, it hinders sound decision-making in stock market investing.

Whatever your assessment of your own confidence, you would do well to remember that few people think they are below-average drivers. Fewer still think they are below-average lovers. To the real Schumachers and Casanovas out there, I salute you, as I suspect you can get by without really needing to be any good at investing.

For the rest of you, I suggest you keep asking yourself why your answer could be wrong and why other answers could be right.


Theories can't count cost of risk

(Published in the South China Morning Post on 19 November 2006)

Risk. It's a word thrown around so frequently in the investment world there's risk-adjusted, systematic risk, specific risk, and we all know that beta, alpha, cost of equity and the Sharpe Ratio have something to do with it. But what is it actually?

In the 1950s, the early pioneers of modern portfolio theory (MPT), such as Harry Markowitz, Merton Miller and William Sharpe, asked themselves this question when they came up with the simple hypothesis that investors get rewarded (with higher returns) for taking on greater risk. For this idea to go any further, though, they had to have a way of quantifiably measuring risk.

They came up with a simple, if controversial, solution: risk (of any asset) can be measured by the standard deviation of historic returns (of that asset). In other words, the more volatile the returns from a given asset the more risky it is.

From this simple assumption - and several others, such as markets being efficient, that one measure of risk applies to all investors, that there are no transaction costs - grew MPT and its flagship, the risk-gauging capital asset pricing model, to this day the cornerstones of the financial economics curriculum in schools, investment associations and financial institutions.

For their work in the field of understanding how asset prices behave, Dr Markowitz, Dr Miller and Dr Sharpe shared the 1990 Nobel Prize in economics. Building upon MPT and work by Robert C. Merton and others, Fisher Black and Myron Scholes published a paper in 1973 introducing the options pricing model that bears their name. Its basic assumption is equities move randomly; that is, their returns are distributed according to the normal bell curve, which charts the frequency of random walk outcomes.

The model assumes that volatility does not change much, and prices options as a function of the historic volatility of the underlying asset.

This worked well in normal market conditions, where changes in volatility were gradual, but if volatility abruptly increased it would break down. Dr Merton and Dr Scholes - members of the team that in 1994 established the ill-fated Long-Term Capital Management (LTCM) hedge fund received the Nobel Prize in 1997 for this and other work.

Best-selling financial author Roger Lowenstein, in When Genius Failed, his excellent book on the US$4 billion collapse of LTCM, said: "Every investment bank, every trading floor on Wall Street, was staffed by young, intelligent PhDs, who had studied under Dr Merton, Dr Scholes or their disciples. The same firms that spent tens of millions of dollars per year on expensive research analysts - i.e. stock pickers - staffed their trading desks with finance majors who put capital at risk on the assumption the market was efficient, meaning that stock prices were ever correct and therefore that stock picking was a fraud."

It is now known that a significant portion of the instructions on Black Monday, October 19, 1987, to sell large blocks of shares came from black box, or automated, trading programs into which the Black-Scholes model had been built. The initial fall in markets caused by Germany's unexpected interest rate increase - and the associated rise in volatility - triggered a self-fulfilling wave of computer-driven panic. The programs were spitting out sell instructions assuming the increased volatility was highly unusual - which in the real world it was not - further increasing volatility and causing more sell instructions.

In the aftermath of the 1987 crash, Harvard economics professor Lawrence Summers, later a United States treasury secretary, remarked to The Wall Street Journal: "The efficient market hypothesis is the most remarkable error in the history of economic theory."

And all of this from the simple assumption that volatility equaled risk. What went wrong?

The dictionary definition of risk is the possibility of loss.

Applied to financial markets, risk should mean the probability that an investment - whether a portfolio or an individual asset - will perform worse than expected.

But whose expectation? After all, expectation is a subjective quantity. In investing, expectation belongs to the investor. Everyone is entitled to have a different expectation for their investments. It is ludicrous to suggest that Warren Buffett and a day trader would see eye to eye on a particular stock, especially if they were both holding it at the same time. One would want the stock to grow at a steady pace over many years, while the other would be happy with a half-point bump before lunch. Yet MPT posits they should see eye to eye, defining risk as the objective historic volatility of a given stock. Furthermore, asset price returns are not normally distributed. In the real world, the supposedly well-distributed curve has a lump at each end, known as the fat tail (see chart). The tails describe extreme events - such as Russia's 1998 debt default that brutally exposed LTCM's weakness – which are not as rare as the theory says they should be.

The ultimate irony about short-lived LTCM - the penultimate one being its name - is that two of its partners, Dr Merton and Dr Scholes, proponents of the Efficient Market Theory, built a model to take advantage of arbitrage opportunities created by market inefficiencies.

These are not new observations, but the speed at which old-established theories are debunked is agonisingly slow. The likes of Mr Buffett who I suspect does not calculate his risks by looking at historic stock price movements - must hope the pace of change remains slow and that the Nobel committee continues to bestow its awards on academics sitting in their ivory towers, far removed from the messy world of nuts, bolts and corporate profits.

So what is the point of all this? My advice is to throw away the textbooks and accept that, at least for most investors, there is no point in worrying about volatility. On the contrary, you should learn to welcome it, as your shares can't go up without it. The only sure fact is that over periods of 10 years or more, markets tend to go up, and that most of this appreciation will be due to rising corporate profits.

Ultimately, the only reliable model of the real world is the world itself. As University of Chicago economist Eugene Fama – often thought of as the father of Efficient Market Theory - famously remarked, life always has a fat tail.

Think before you invest - overconfidence is a killer

(Published in the South China Morning Post on 15 October 2006)

In a November 2005 report, James Montier, the maverick global equities strategist for investment bank Dresdner Kleinwort Wasserstein in London, identified seven deadly sins of fund management. For that matter, they apply just as well to any investor.

They are: poor forecasting; being fooled by the illusion of knowledge; being mesmerised by company management; believing you can out-smart everyone else; short-time horizons and over-trading; believing everything you read; and group think.

In varying proportions, he argued, they were all responsible for the poor decision-making that leads to unhappy returns. The performance of funds, after all, or any investment portfolio, is the result of a series of buy and sell decisions. The fact that around 70 per cent of actively traded funds does worse than their benchmark indices suggests that the average fund manager may actually be hardwired to make poor decisions.

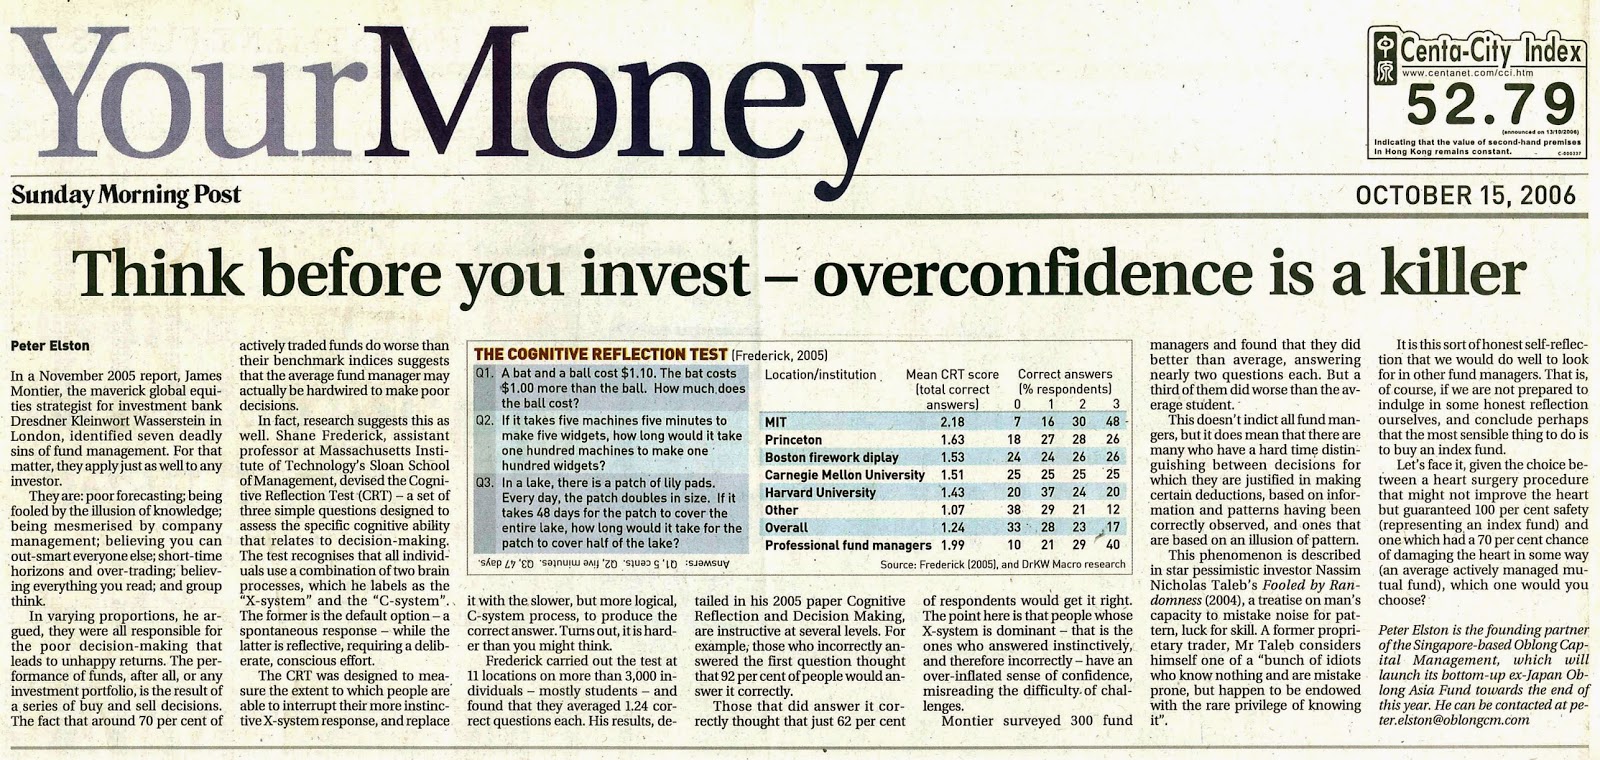
In fact, research suggests this as well. Shane Frederick, assistant professor at Massachusetts Institute of Technology's Sloan School of Management, devised the Cognitive Reflection Test (CRT) — a set of three simple questions designed to assess the specific cognitive ability that relates to decision-making. The test recognises that all individuals use a combination of two brain processes, which he labels as the "X-system" and the "C-system". The former is the default option — a spontaneous response — while the latter is reflective, requiring a deliberate, conscious effort.

The CRT was designed to measure the extent to which people are able to interrupt their more instinctive X-system response, and replace it with the slower, but more logical, C-system process, to produce the correct answer. Turns out, it is harder than you might think (see the original at the bottom of this post for the test questions and answers).

Frederick carried out the test at 11 locations on more than 3,000 individuals — mostly students — and found that they averaged 1.24 correct questions each. His results, detailed in his 2005 paper Cognitive Reflection and Decision Making, are instructive at several levels. For example; those who incorrectly answered the first question thought that 92 per cent of people would answer it correctly.

Those that did answer it correctly thought that just 62 per cent of respondents would get it right. The point here is that people whose X-system is dominant — that is the ones who answered instinctively, and therefore incorrectly — have an over-inflated sense of confidence, misreading the difficulty. of challenges.

Montier surveyed 300 fund managers and found that they did better than average, answering nearly two questions each. But a third of them did worse than the average student.

This doesn't indict all fund mangers, but it does mean that there are many who have a hard time distinguishing between decisions for which they are justified in making certain deductions, based on information and patterns having been correctly observed, and ones that are based on an illusion of pattern.

This phenomenon is described in star pessimistic investor Nassirn Nicholas Taleb's Fooled by Randomness (2004), a treatise on man's capacity to mistake noise for pattern, luck for skill. A former proprietary trader, Mr Taleb considers himself one of a "bunch of idiots who know nothing and are mistake prone, but happen to be endowed with the rare privilege of knowing it".

It is this sort of honest self-reflection that we would do well to look for in other fund managers. That is, of course, if we are not prepared to indulge in some honest reflection ourselves, and conclude perhaps that the most sensible thing to do is to buy an index fund.

Let's face it, given the choice between a heart surgery procedure that might not improve the heart but guaranteed 100 per cent safety (representing an index fund) and one which had a 70 per cent chance of damaging the heart in some way (an average actively managed mutual fund), which one would you choose?


Too many eggs in investment baskets

(Published in the South China Morning Post on 17 September 2006)

Everyone knows that diversification reduces risk. Except, of course, when it doesn't. It took the world some time to notice diversification was generally bad for conglomerates, and these inexpert, overstuffed dinosaurs are gradually becoming extinct.

Why? Because it is improbable that one management team will be the best manager of a wide range of assets in a wide range of industries. We all know that about industry, but often find it harder to accept in our own financial markets.

You might think that this column is going to look at why one shouldn't buy into chaebol and conglomerates. But I have a simpler point to make. Last month I looked at why the better mutual funds mostly keep their stocks for the long term. Today, I suggest that there is also a relationship between these good long-term performers and their high portfolio concentration. A portfolio with fewer holdings tends to do better than large shallow baskets of stocks.

Again, this can be explained in terms of the psychology of the fund manager. A good fund manager needs to deploy the same courage in selectively choosing a stock as he does in holding it for the long term. The courage necessary to turn expert views into substantial profits is, however, a rare quality.

In his 1973 classic, The Intelligent Investor, Benjamin Graham points to the experience of IBM stock in the 1960s. The renowned Columbia University economist writes that "smart investors would long ago have recognised the great growth possibilities of IBM", but that "the combination of [IBM's] high price and the impossibility of being certain about its rate of growth prevented [investment funds] from having more than, say, 3 per cent of their funds in this wonderful performer".

Typical mutual funds are highly diversified, holding more than 100 stocks. That is because, in addition to lacking conviction in their own analysis, they have one eye on keeping up with a benchmark index. Such behaviour is counterproductive.

The majority of actively managed diversified funds don't even match the index, because they have too many holdings to keep track of effectively.

Furthermore, their lack of knowledge in each of their individual holdings means that they are more likely to bail out during a wobble, resulting in higher turnover, which as I pointed out last month, also cuts into a fund's performance.

So the potential for good fund performance increases by holding fewer stocks. There are of course exceptions, but around 70 per cent of mutual funds under perform their benchmark.

The above phenomenon is actually founded on the basic observation that the chance of an investment decision contributing positively to a fund's performance is proportional to the amount of time spent on making - and monitoring - that decision. Since there are only so many hours in the day, a fund manager with lots of holdings is going to spend less time on each decision and thus get a smaller proportion of them correct.

Of course, there is a point at which concentration starts to weaken a fund's risk-return profile – a one-stock portfolio is clearly a bad idea - but there is an optimal level to aim for. The graphic suggests that investment either in an index fund or, if you believe in active management, one with a high degree of concentration are the rational choices. Anything in between just doesn't make sense.

How do we define the optimum portfolio size?

Generalised graphics can't tell us, for it is defined by the qualitative characteristics of the fund manager. The answer is not 18 or 26, but simply: what range of stocks can that manager understand to a degree of aggressive confidence? The intuitive answer is that the perfect fund manager will be able to understand a wide range of stock. In the real world, the key is the inverse: the perfect fund manager is the one who accepts what he doesn't know enough about, and chooses ruthlessly to exclude it.

For the investors seeking out highly focused fund managers, the problem is that the large fund companies do not tend to offer highly concentrated mutual funds since their size forces them into buying many different stocks. Their very bulk works against them.

One of the most concentrated large fund management houses is the Scotland-based Aberdeen Asset Management - which has US$130 billion under management — and even they have around 50 holdings in their regional fund.

That is why highly concentrated, funds will remain a niche product and, therefore, the realm of the boutique managers.

One such fund is Apollo Asia Fund, managed by Claire Barnes. It has around 23 holdings - the 12 largest representing nearly 80 per cent of the fund - and its net asset value has appreciated 14 times in the nine years since launch, equating to 35 per cent per annum.

However, the fund is generally closed to investors and has been turning away most subscriptions since early 2003, so as to restrain its size and maintain flexibility.


Portfolio management is a little like juggling. To keep an eye on your job and perform impressively it is advisable to throw fewer balls, higher.


Mutual funds - watch out for flapping feet

(Published in the South China Morning Post on 20 August 2006)

Most of us know of the proverbial swan, sailing seemingly serenely across the surface of a lake, while obscured by the water its legs paddle like crazy. The performance of certain mutual funds brings to mind an inverted swan: with its big feet flapping in the air, frantic activity is there for all to see, but the poor thing is going nowhere, and probably drowning.

Put simply, paddling to and fro is not in itself a measure of achievement. Indeed, it is often counter productive. A 2003 research report by CSFB of US mutual fund data from Morningstar revealed that funds with lower turnover performed better over all periods of more than two years. That is why looking at the "turnover" of a fund's portfolio is very instructive.

According to the study, funds that turned over an average of less than 20 per cent of their portfolio annually returned 179 per cent of value over 10 years. This compared with a 143 per cent return for funds that turned over an average 20-50 per cent of their portfolio a year, 130 per cent for those that turned over between 51 and 100 per cent of their portfolio, and a miserable 112 per cent return for those that turned over more than 100 per cent.

In other words, funds that did the best were holding on to their investments for an average of at least five years. This simple statistic raises two basic questions. Why does taking a longer-term view yield better results? (The higher transaction costs associated with high turnover can only explain a smidgen of the divergence.) And why, given the clear facts, does anyone invest in higher turnover funds?

The explanation for the attraction to many of the higher-turnover funds is rooted in the often-irrational characteristics of human behaviour, specifically a phenomenon known as "myopic loss aversion", a term coined by leading behavioural economists Shlomo Benartzi and Richard Thaler in 1995.

This phenomenon refers to the fact that humans are much more sensitive to losses than to gains (loss aversion) and that we compound the problem by evaluating our portfolios over short timeframes (myopia). In other words, we tend to look at our portfolios too often, and compounding the problem, when we see a dip, we overreact.

If we were able to stop ourselves from looking at short-term price fluctuations, we would be far less likely to be aware of the dips, and therefore much more comfortable holding onto shares or funds for the long term, an approach that, as we have seen above, yields the best results.

Why do they yield best results? Investment returns reflect one's ability to predict future share price movements. Every individual share price movement, over any time frame, is a function, in varying proportions, of the company's profits on the one hand, and market psychology on the other. Over the short term, market sentiment almost entirely influences share price movements, but over the longer term profits dominate.

The difference between short-term investing and long-term investing is the difference between predicting how investors are going to behave versus how a company's assets are going to behave. To illustrate why the latter is easier, take the hypothetical example of a listed property investment company that owns one new office building. Would you be more confident in predicting the company's share price in six months or predicting whether the building will still be standing five years from now?

Many fund managers' investment decisions are the result of herd mentality and panic: buying shares that have recently performed well or selling shares that have recently fallen, actions that more often than not tend to backfire. Few stampeding cattle have the objectivity or distance to really understand why they are running, or to assess whether they are at the front, back or in the middle of the herd. Nor would one expect many to have the strength of mind to stop for a little quiet reflection.

In addition, many fund managers often feel compelled to be doing things, to be frequently making decisions, to buy and sell, all the while egged on by brokers. How can you be guaranteed to avoid such managers? By investing in funds with low turnover. As best-selling financial author Roger Lowenstein pointed out about high-turnover funds in his SmartMoney column: "They aren't investing in stocks any more than a cheap date on Saturday night is akin to an engagement."